

For the last ten years I have made it my mission to teach educators to help children become critical consumers and creators of data. Our Geographic Information Systems Institute at Southern Connecticut State University provided us with the perfect venue to continue this works.
GIS boils down to making arguments with maps.
Mentor Texts
We began our instruction by examining mentor texts. I set up the sessions trying to model the steps teachers should take with their students.
Choose two of the inquiry questions below:
Which towns in CT are at the highest risk for lead poisoning?
Where does abuse and neglect happen in CT?
Does income affect life expectancy in CT?
Is medical marijuana impacting in CT?
We looked at the inquiry questions first and wanted to decide if these were compelling and open ended. For example teachers felt the second questions had well defined answers. We modified that question to, “Does where some lives increase there chance at abuse and neglect.”
Next we focused on how the data, presented in these informational texts, could be used to support claims in an argumentative text.
Annotate for Arguments
We then looked at two pieces that had different positions on the role of obesity in America. One source argued it was a racial issue and another argued that it was access to healthy food. We then discussed how to use Hypothes.is, an open source annotation tool, to code these documents.
We explored developing code books that included, claim, evidence, source, warrants, map data, and numerical data. We set up a private group and played with annotations.
Source One:
Read this piece about obesity in America.
What is the author’s main claim? How does the author use evidence to support this claim?
Annotate the claims and evidence used by the author. Evaluate the strengths and weaknesses of the evidence.
Source Two:
Read this piece about obesity in America.
What is the author’s main claim? How does the author use evidence to support this claim?
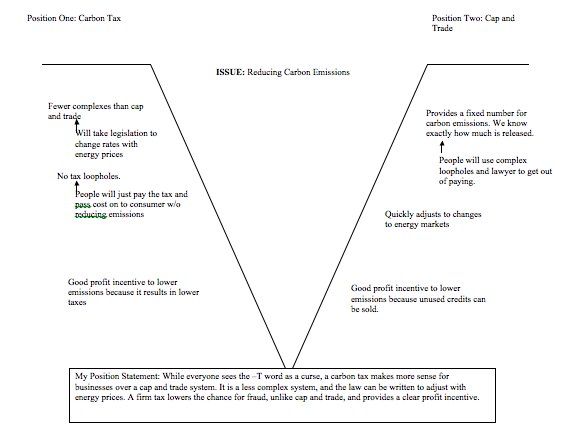
Investigate Using Argumentative Vee Diagrams
Next we looked at a series of maps to answer the question “Does race or geography affect obesity?”


In order to organize our conclusions around an inquiry question we used argumentative vee diagrams. This tool asks you not to take a position at the beginning. Instead you develop claims and evidence from each side. Then you write rebuttals for each claim from the other side of the issue. Once done students then write a position statement.
GIS is Data. Data are Arguments
As we finish out the institute I look forward to the inquiry projects teachers create for our students. The discourses and tools of social sciences and historians rely on using maps in our arguments.
Want to learn more about how we shape learning or interested in brining a GIS institute to your school then subscribe below:
[subscribe2]